bike

Bicycle Accident Statistics

A Comprehensive Look

America’s roads are dangerous for cyclists. In fact, the United States reports more fatal and injury-causing traffic accidents than most other countries. Early estimates from the NHTSA say that, in 2019, there were 846 cyclists killed in U.S. traffic accidents. Since more people are bicycling for exercise, to save on gasoline, to commute to work, or just for fun, bicycle safety has become more important than ever.

How Many Bicycle Accidents Occur Each Year?

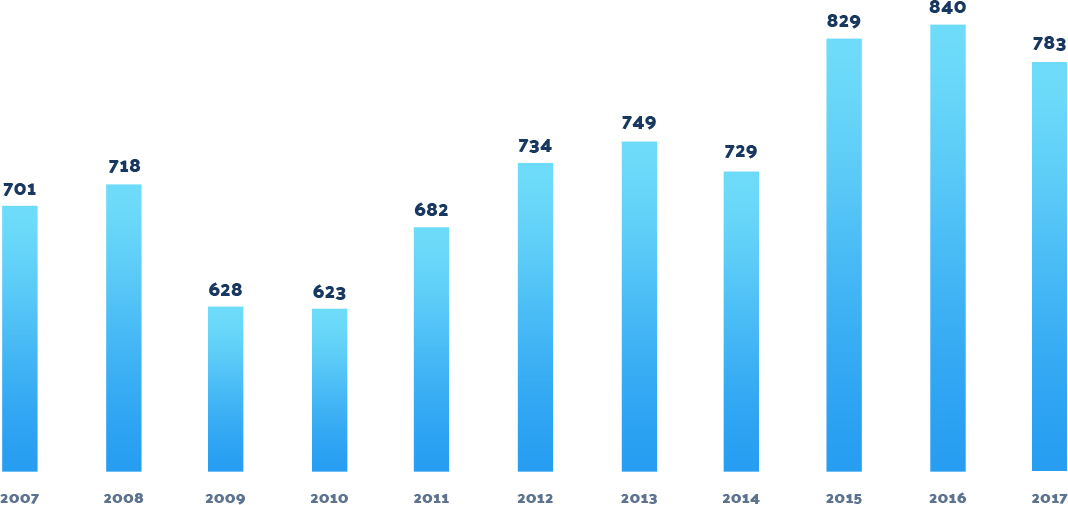
According to the National Highway Traffic Safety Administration (NHTSA), cyclist fatalities had fallen to a record low of 621 in 2010, but by 2016, pedalcyclist (bicyclists and other cyclists - including riders of two-wheeled, nonmotorized vehicles, tricycles, and unicycles) fatalities soared 35% from the 2010 low to a high 840. Cyclist deaths then hit a ten year high of 871 in 2018 (initial NHTSA reports stated 857, but updated releases have put the total at 871) and now estimates show 846 deaths for 2019.

U.S. Cyclist Fatalities

2007 - 2017

fatalities-chart

Nhtsa, 2019

In 2018, there were 871 bicyclist fatalities, the highest single year death count since 1988.

Every year in the U.S., nearly 2% of all motor vehicle involved crash deaths are cyclists (pedalcyclists). While early estimates say that pedalcyclist fatalities decreased a little over 2% in 2019 (from 871 deaths in 2018 to 846 in 2019), pedalcyclist deaths have actually increased in urban areas - making up over 79% of all deaths.

Additionally, it is important to note that the proportion of people killed “outside the vehicle” (motorcyclists, pedestrians, pedalcyclists, and other nonoccupants) increased from 20% in 1996 to 33% in 2017. In fact, there were 6,205 pedestrians and 846 cyclists killed in crashes with motor vehicles in the United States in 2019. It goes without saying that pedestrians and cyclists are at a major disadvantage when it comes to being involved in traffic crashes; it is a scenario where the vehicle always wins.

Since helmet laws have been instituted in the majority of states, at least for children, the death rate for that age group has decreased, but research shows that over half of adult cyclists still do not use a helmet at all. Since the most serious personal injuries in crashes for cyclists are to the head, the death rate for adult riders is still too high.

One recent study conducted by researchers at UCSF (2017) reported that, over a 17-year period, the medical costs of bicycle injuries to adults in the United States, both fatal and non-fatal, amounted to $237 billion. “There were 3.8 million non-fatal adult bicycle injuries and nearly 9,839 deaths that were reported during the study period from 1997 to 2013. Men accounted for three-quarters of the total costs” (Science Daily, 2019). In fact, head injuries tend to be the most common injury among those who visit emergency rooms and are those that result in hospital inpatient stays.

Researchers at UCFS (2017) Reported

Over a 17-year period, the medical costs of bicycle injuries to adults in the United States, both fatal and non-fatal, amounted to $237 billion.

bike

More Bicycle Accident
Statistics

  • Children under the age of 15 make up 4% of bicycle fatalities.
  • Deaths among bicyclists age 20 and older have tripled since 1975.
  • Bicyclist deaths were 8 times higher in males than females. Alcohol was involved in 37% of crashes.
  • Riders are more likely to be involved in an accident when they are distracted. Too many cyclists are using hands-free cell phone devices and/or wearing headphones and risking their lives doing so.
  • From 1980 to 2010, annual cyclist deaths declined more than 33%, from more than 960 to less than 630. Between 2010 and 2016, however, they increased again, reaching 852 in 2016.
  • In 2003, pedestrians and cyclists represented 12.6% of total traffic fatalities; in 2017 that number rose to 18.2%.
  • In the ten-year period between 2008 and 2017, pedestrian and bicyclist fatalities increased by 32%.
  • The largest percentage of male cyclists who sustain injuries tend to be between the ages of 45 and 64.
  • The average age of cyclists who died in motor-vehicle collisions increased from 2007, when it was 40, to between 41 and 47 in 2018.
  • Hit and run incidents involving cyclists, are becoming particularly more problematic, especially in urban areas. In fact, the AAA Foundation for Traffic Safety (2018) reported that more than one hit-and-run crash occurs every minute on U.S. roads.
  • Nearly 65% of those killed in hit and run accidents involved pedestrians and cyclists.

Bicycle Accident Location
and Demographic Statistics

In 2017, Pedalcyclist Fatalities Were Highest In
florida

125

Florida Fatalities

california

124

California Fatalities

texas

59

Texas Fatalities

  • Florida, California and Texas lead the nation in 2017 bicycle accident fatalities, with 125, 124 and 59 respectively.
  • When looking at cyclist fatality rate per million population, Florida maintains its top position with (5.96 fatalities per million residents) followed by Delaware (5.20 fatalities per million residents), compared to the national rate of 2.40. Of those States that experienced pedalcyclist fatalities, Connecticut had the lowest fatality rate per million population (0.84) followed by Montana (0.95) (NHTSA, 2019).
  • In approximately 35% of the fatal bicycle accidents, alcohol was a contributing factor.
  • In 2017, the average age of cyclists killed in traffic crashes was 47 years old (NHTSA, 2019).
  • The majority (89%) of pedalcyclists killed in 2017 were males.
  • Male cyclists between the ages of 55 and 59 years of age made up the largest percentage of those who sustained injuries in bicycle accidents.
  • In 2016, 4% of pedalcyclist accidents happened in designated bike lanes while near 30% of fatalities happened at an intersection.

In 2016

4% of pedalcyclist accidents happened in designated bike lanes while near 30% of fatalities happened at an intersection.

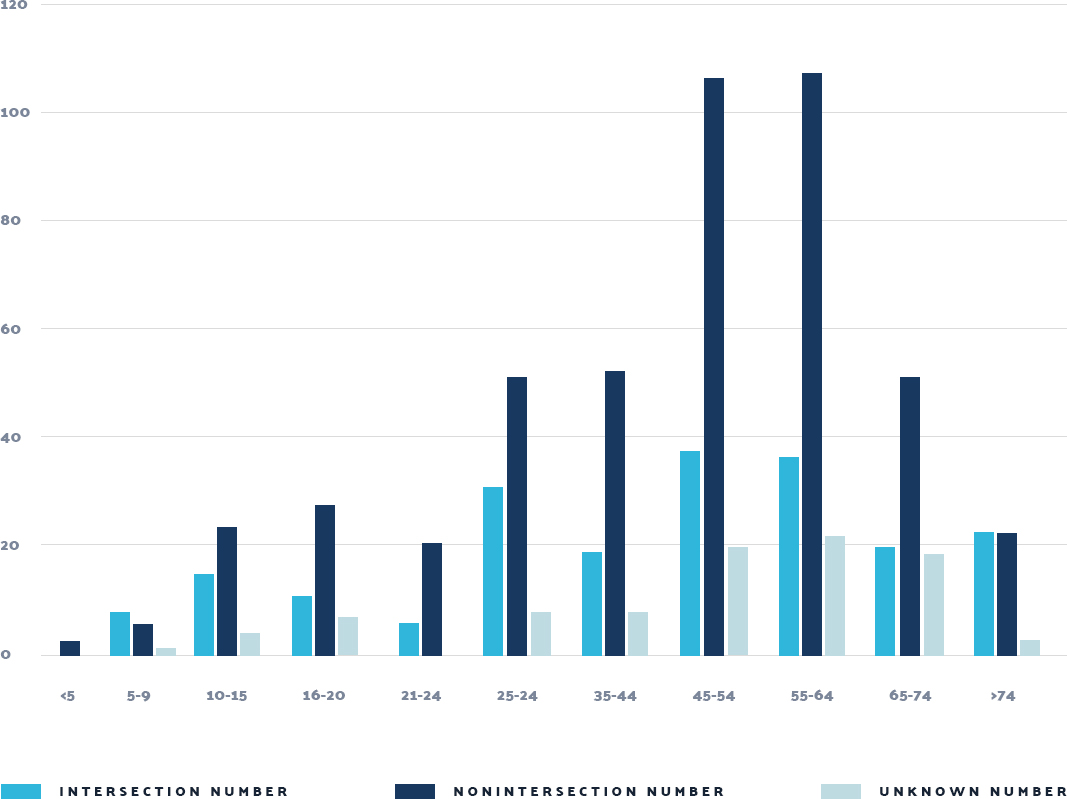
The majority of fatal bicycle accidents (71%) occur in urban areas and at non-intersections (58%). In 2017, bicycle fatalities occurred most often in cyclists between the ages of 50 and 54.

Cyclist Fatalities by Age
Group and Location

Most Dangerous
Times to Ride a Bicycle

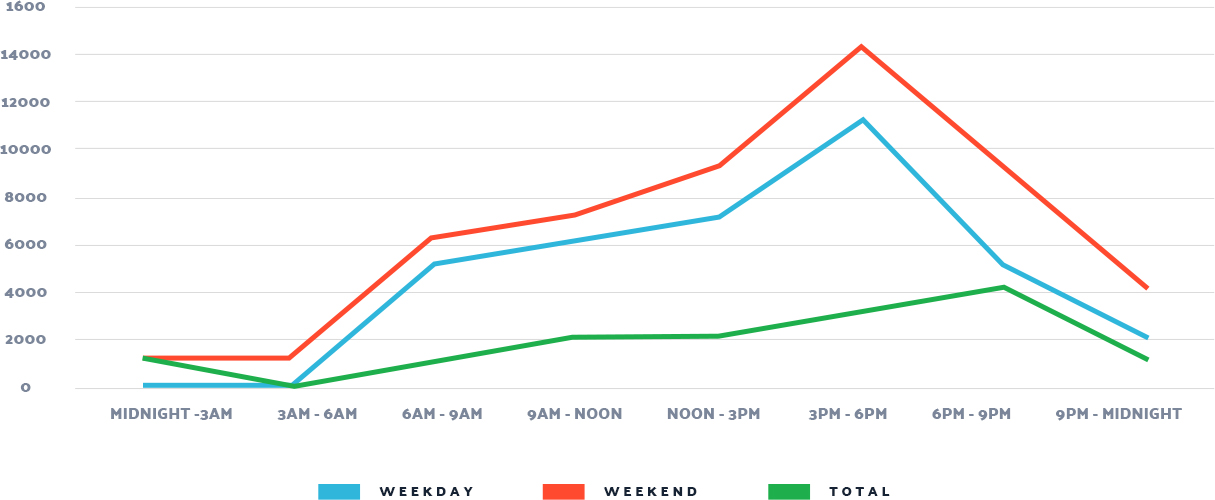
Time of day and day of the week (weekday vs. weekend) impacts cyclist injury reports; the majority take place when lighting conditions are low on the weekends (green line), and when traffic is high during the week (blue line). The red line represents total pedalcyclist injuries overall (FARS, 2017; CRSS, 2017).

Cyclist Injuries Day and Time

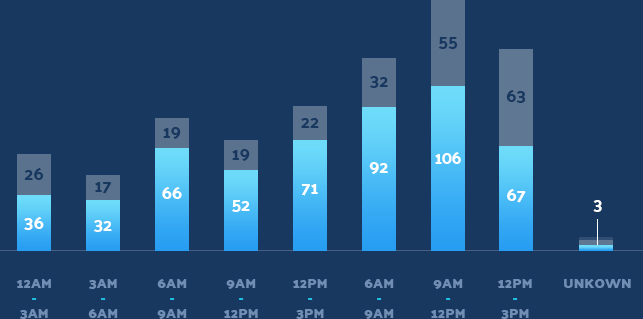
Bicyclist Fatalities Affected
by Time of Day As Well

Both time of day and lighting conditions are also major factors in bicyclist fatalities; 45% occur in dark conditions. The hours from 6:00pm to 9:00pm tend to account for more bicyclist fatalities than other times of day.

Weekday

Weekend

Unknown

The Most Dangerous
Cities for Bicyclists

Based on Data from 2017

New York City, NY

Seattle, WA

San Jose, CA

San Francisco, CA

Boston, MA

Washington D.C.

Austin, TX

Phoenix, AZ

Los Angeles, CA

Fresno, CA

Most of these cities have seen a major increase in the number of cyclists on the roads. San Francisco, for example, saw a 13% increase in riders since 2011, while the NHTSA, which is part of the Department of Transportation (DOT), found that New York had the most cyclist fatalities of any city in the country during 2017.
Only 4 major cities reported zero pedalcyclist fatality crashes in 2017: San Diego, Detroit, Nashville, and Baltimore.

As for states, Florida leads the nation in bicycle fatalities, accounting for 16% of all cyclist fatalities in 2017, with California close behind.

The most common reported factors in bike fatalities were:

38%

Failing to Yield The
Right of Way

8%

Failing to Obey
Traffic Signs

10%

Not Being
Visible

8%

Making an
Improper Turn

The Soaring Cost of Bicycle
Accidents in the U.S.

While bicycle use has become increasingly popular, it has led to more and more accidents, especially in heavily populated urban areas. According to a study conducted by U.C. San Francisco (2013), the medical costs from non-fatal bike crashes have climbed steadily over the years by $789 million annually. They concluded that at the time of their study, both fatal and non-fatal injuries in the U.S. have amounted to $237 billion.

Studies show that over the last 15 years, hospital admissions due to bike crashes have increased by 120%

Among the Key Findings:

Bicycle
Helmet Laws

Bicycle helmets have been proven to reduce the risk of serious head injuries in forceful impacts. In fact, wearing a properly fitting bicycle helmet is the single most important way of protecting yourself from a traumatic head injury. Unfortunately, less than half of the millions of those who ride bicycles use helmets; researchers have found that only 48% of children wore helmets when riding their bikes and that adult cyclists were far less likely to do so.

States began adopting laws in 1987 for bicycle helmets, but most are limited to children under the age of 18. Currently, there is no federal law requiring bicycle helmets, but there are 49 all-ages laws. Currently, 22 States and D.C. have state-wide laws, and more than 201 localities have local ordinances. See the chart below compiled by the Bicycle Helmet Safety Institute (2019) for more info on helmet laws in the U.S.

State
Jurisdiction
Ages & Conditions
Effective Date
Alabama
Montevallo
All ages
1993
Homewood
All ages
1994
California
Bidwell Park, Chico
(for off road in middle &
upper park)
All ages
1991
Connecticut
City of Seymourt
(Repealed 1998)
All ages
1998
Illinois
Chicago (messengers)
All ages
Kentucky
Louisville Extreme Park
All ages
2002
Maryland
Sykesville*
All ages
1995
Michigan
Kensington Metropark
All ages
1998
Mississippi
Starkville
All ages*
2010
Missouri
St Louis County
municipalities of:
Bel-Ridge
All ages
2002
Berkeley
All ages
2000
Black Jack
All ages
2008
Calverton Park
All ages
2001
Creve Coeur
All ages
2000
Glendale
All ages
2000
Grantwood Village
All ages
2003
Hillsdale
Pagedale
All ages
2002
Sycamore Hills
All ages
2008
Town & Country
All ages
2002
Velda City
All ages
2006
Velda Village Hills
All ages
2005
New York
Greenburgh*
All ages
1994
Rockland County*
All ages
1992
North Carolina
Black Mountain*
All ages
1996
Boone*
All ages
1995
Ohio
Shaker Heights
All ages over 5
inc. passengers
1996
Oklahoma
Oklahoma City
(City property only)
All ages
1999
Washington State
Aberdeen
All ages*
2001
Auburn
All ages
2005
Bainbridge Island
All ages
2001
Bellevue
All ages
2002
Bremerton
All ages
2000
Des Moines
All ages
1993
DuPoint
All ages
1993
Duvall
All ages
1996
Eatonville
All ages
1996
Enumclaw
All ages
1993
Fircrest
All ages
1995
Gig Harbor
All ages
1996
Hunts Point
All ages
1993
Island County:
Recommendation only
All ages
1997
Kent
All ages
1999
King County
All ages
1993
Lakewood
All ages
1996
Milton
All ages*
1997
Pierce County
All ages
1994
Port Angeles
All ages
1994
Port Orchard
All ages
2004
Puyallup
All ages
1994
Renton
All ages
1999
Seatac
All ages over 1yr
1999
Seattle
All ages
2003
Snohomish city-wide
ordinance repealed
All ages*
2002
Snohomish
skate park only
All ages*
2002
Snoqualmie
All ages
1996
Spokane
All ages*
2004
Steilacoom
All ages
1995
Tacoma
All ages*
1994
University Place
All ages
1996
Vancouver
All ages
2008
West Virginia
Steilacoom
All ages
1995

* Also covers one or more non-bicycle wheeled vehicles: in-line skates, roller skates, skateboarders, non-motorized scooters. There are other laws that cover them too, but we don't have the info on all of them yet. New Mexico was the first to include tricycle riders.
** Florida permitted counties to opt out. Three initially did so, but now have all rescinded their exceptions. Private property (a driveway, for example) was excluded but all roads and trails are covered.
*** Jackson, MS law exempts riders who are riding in a cul-de-sac or dead-end street in a residential area.
**** Virginia's state enabling legislation permits localities to adopt laws covering only children under the age of 15. Although as shown by the blanks we do not have official confirmation in every case, all of the Virginia laws we have found specify "fourteen and younger" (shown as under 15 in our table).

Cycling Safety Tips

By law, bicycles on the road are vehicles with the same rights and responsibilities as motor vehicles, so it is important that cyclists know the laws and abide by them for their own safety. It is also important to remember that in a crash between a cyclist and a vehicle, the cyclist will always be the most vulnerable, so no matter who has “the right of way,” cyclists must remain vigilant to their surroundings at all times.

  • Always ride with the flow of traffic. Know the bike laws in your area and use hand signals so that cars around you will know your intentions.
  • Avoid distractions; listening to music and talking on your phone while riding can put you and others in danger.
  • Be extra cautious when it is dark outside. If you must ride at night or in times of low light, wear reflective gear and make sure your bike has front and rear lights. It is obviously more difficult for drivers to see you when visibility is poor.
  • Wear safety gear, including properly fitting helmets and gloves, in order to protect yourself in case of a fall.
  • In 2017, 82% of cyclists in accidents were struck by the front of the vehicle, so make sure they can see you.
  • Make sure your bike is in proper working condition before taking it out on the road and use a mirror so you can keep an eye on traffic.
  • Finally, while both motorists and cyclists play a part in sharing the road, cyclists can do their part by wearing bright colored clothing and a helmet while riding.

Resources

https://crashstats.nhtsa.dot.gov/Api/Public/ViewPublication/812765

https://www.governing.com/gov-data/transportation-infrastructure/most-bicycle-cyclist-deaths-per-capita-by-state-data.html

https://www.iihs.org/topics/fatality-statistics/detail/bicyclists

http://www.pedbikeinfo.org/factsfigures/facts_safety.cfm

https://crashstats.nhtsa.dot.gov/Api/Public/ViewPublication/812603

https://www.ghsa.org/issues/bicyclists-pedestrians

https://cdan.nhtsa.gov/SASStoredProcess/guest

https://cdan.nhtsa.gov/tsftables/tsfar.htm#

https://www.ghsa.org/issues/bicyclists-pedestrians

http://www.pedbikeinfo.org/factsfigures/facts_safety.cfm

https://www.peoplepoweredmovement.org/

https://www-fars.nhtsa.dot.gov/People/PeoplePedalcyclists.aspx

https://www.yoursun.com/arcadia/sports/florida-worst-state-for-bicycle-fatalities/article_1e37e02a-8ba1-11e9-a010-2fc8c97945bc.html

https://crashstats.nhtsa.dot.gov/Api/Public/ViewPublication/812603

https://pennygeeks.com/legal-resources/statistics/bicycle-accidents/

https://www.helmets.org/allageshelmetlaws.htm

https://www.iii.org/fact-statistic/facts-statistics-sports-injuries

https://www-fars.nhtsa.dot.gov/Main/index.aspx